Mastering Asset Group Analysis in Performance Max Campaigns for Better ROI
Performance Max campaigns are changing how businesses run their ads by using Google’s smart technology to reach customers on different platforms. To get the best results, it's important to use an Asset Group Analysis script for P Max. This script helps you see how each part of your ads is performing, making it easier to improve your campaigns. In this blog, we will show you how to use this script and why it matters. Whether you're selling products, getting leads, or building your brand, this guide will help you make better decisions based on your data. For more tips on optimizing your ads, check out our all-in-one Google Ads script to simplify keyword optimization.
What Are Asset Groups in Performance Max Campaigns?
Performance Max campaigns streamline your advertising efforts by grouping various creative assets and targeting signals into cohesive units known as asset groups. These asset groups serve as the foundation for your campaign's performance, enabling Google’s machine learning algorithms to optimize ad delivery across multiple channels, including Search, Display, YouTube, and more.
Key Components
- Creative Assets: Each asset group comprises different creative elements such as headlines, descriptions, images, and videos. These creatives are designed to capture the attention of your target audience and drive engagement.
- Targeting Signals: Asset groups also include targeting signals like specific audiences, locations, and device preferences. These signals guide the algorithm in reaching the most relevant users for your ads.
Why They Matter
Each asset group is meticulously crafted to optimize performance based on its unique setup and inputs. By organizing your campaign into distinct asset groups, you can better monitor and adjust individual elements, ensuring that each segment contributes effectively to your overall marketing goals. This structured approach not only enhances the efficiency of your campaigns but also provides deeper insights into what drives success.
Why Analyzing Asset Group Performance is Crucial
Relying solely on Google’s AI to optimize your Performance Max campaigns without monitoring individual asset group performance can be risky. Here’s why analyzing asset groups is essential:
The Problem with Blind Trust
While Google's machine learning is powerful, it operates based on the data and signals provided. Without actively monitoring, you risk missing out on identifying underperforming creatives or ineffective targeting signals that could be draining your budget without delivering results.
Opportunities for Optimization
- Identify Underperforming Creatives: By analyzing asset groups, you can pinpoint which headlines, descriptions, or media are not resonating with your audience and make necessary adjustments.
- Evaluate Audience Signal Effectiveness: Assess the performance of different audience segments to refine your targeting strategies, ensuring you reach the most responsive users.
- Control Costs More Efficiently: Understanding which asset groups deliver the highest ROI allows you to allocate your budget more effectively, maximizing your ad spend.
Real-World Example
Imagine running a Performance Max campaign for an e-commerce store. Through asset group analysis, you discover that a particular set of headlines and images consistently underperforms, leading to high costs and low conversions. By identifying this inefficiency, you can replace these elements with more effective creatives, thereby improving overall campaign performance and reducing wasted spend.
Key Metrics to Monitor in Asset Group Performance
To effectively analyze asset groups, it’s crucial to track specific metrics that provide insights into their performance. Here are the key metrics to monitor:
Metrics Breakdown
- Impressions: This metric indicates how often your ads are being displayed. High impressions suggest good visibility, but it's essential to ensure these are translating into meaningful engagement.
- Clicks: Clicks measure user engagement with your ads. A high number of clicks relative to impressions (click-through rate) indicates effective ad content.
- Conversions and Conversion Value: These metrics track the actions users take after clicking your ads, such as purchases or sign-ups, and the value they bring. They are critical for measuring ROI.
- Cost (Micros): Understanding your budget allocation at the asset group level helps you manage spending and identify areas where costs can be optimized.
How to Use This Data
Interpreting these metrics allows you to make informed decisions about which asset groups to enhance or discontinue. For instance, if an asset group has high impressions but low conversions, it may need better-targeted creatives or improved audience signals. Conversely, asset groups with high conversion rates can receive increased budget allocations to maximize their impact.
How to Extract Asset Group Performance Data
Extracting detailed performance data is a vital step in asset group analysis. Here’s a step-by-step guide to help you gather the necessary information using Google Ads Scripts:
Step-by-Step Guide
- Introduce Google Ads Scripts: Google Ads Scripts are a powerful tool for automating data extraction and reporting. They allow you to customize and streamline the process of gathering asset group performance data.
- Set Up the Script: Use the provided script to extract asset group performance data. Update the script with your specific Google Sheets URL and desired date range to ensure accurate data collection.
Asset Group Analysis Script
function main() {
  // Your Google Sheets URL
  const spreadsheetUrl = "https://docs.google.com/spreadsheets/d/add_your_spreadsheet_url_here";
  const sheetName = "Asset Group Performance";

  // Custom date range (YYYY-MM-DD format)
  const startDate = "2025-01-01"; // Change this to your desired start date
  const endDate = "2025-01-28";   // Change this to your desired end date

  // Open the spreadsheet and sheet
  const spreadsheet = SpreadsheetApp.openByUrl(spreadsheetUrl);
  const sheet = spreadsheet.getSheetByName(sheetName) || spreadsheet.insertSheet(sheetName);
  sheet.clear(); // Clear previous data

  // Add headers to the sheet
  sheet.appendRow([
    "Campaign ID",
    "Campaign Name",
    "Asset Group ID",
    "Asset Group Name",
    "Impressions",
    "Clicks",
    "Conversions",
    "Conversions Value",
    "Cost (Currency)" // Costs converted from micros
  ]);

  // Query with custom date range
  const query = `
    SELECT
      campaign.id,
      campaign.name,
      asset_group.id,
      asset_group.name,
      metrics.impressions,
      metrics.clicks,
      metrics.conversions,
      metrics.conversions_value,
      metrics.cost_micros
    FROM
      asset_group
    WHERE
      campaign.advertising_channel_type = 'PERFORMANCE_MAX'
      AND segments.date BETWEEN '${startDate}' AND '${endDate}'
    ORDER BY
      metrics.impressions DESC
  `;

  // Execute the query
  const report = AdsApp.report(query);

  // Process and add data rows to the sheet
  const rows = report.rows();
  while (rows.hasNext()) {
    const row = rows.next();
    // Convert cost from micros to currency
    const costInCurrency = row['metrics.cost_micros'] / 1000000;

    sheet.appendRow([
      row['campaign.id'],
      row['campaign.name'],
      row['asset_group.id'],
      row['asset_group.name'],
      row['metrics.impressions'],
      row['metrics.clicks'],
      row['metrics.conversions'],
      row['metrics.conversions_value'],
      costInCurrency.toFixed(2) // Round to 2 decimal places for neatness
    ]);
  }

  Logger.log("Data successfully exported to the Google Sheet for the custom date range.");
}
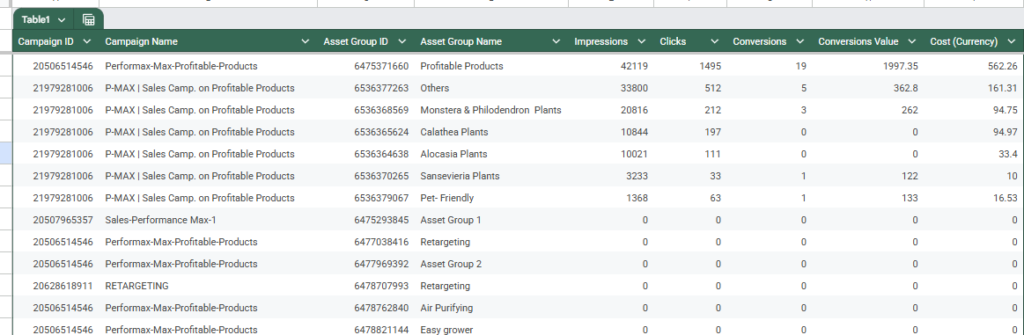
3. Export Data to Google Sheets: The script automatically exports the asset group performance data to a specified Google Sheet, making it easy to analyze and visualize.
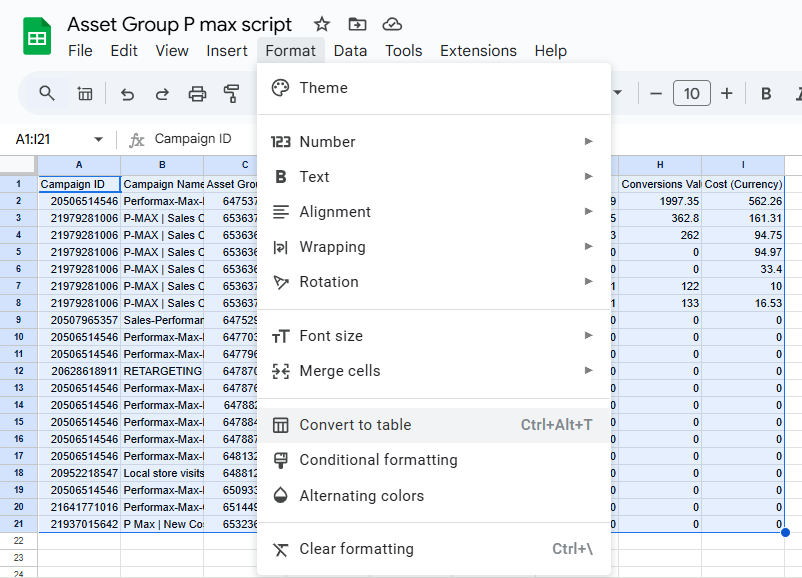
4. Select the table, go to format and click on convert to table for better view.
It will look something like this:
Pro Tip
Utilize custom date ranges to evaluate performance trends over specific periods. This approach helps in identifying seasonal patterns or the impact of specific marketing initiatives on your asset group performance.
Optimizing Asset Groups Based on Insights
Once you have extracted and analyzed your asset group data, the next step is to implement optimizations based on your findings. Here’s how to enhance your asset groups effectively:
Creative Adjustments
- Replace Low-Performing Headlines or Descriptions: If certain headlines or descriptions aren’t driving engagement, swap them out with new, more compelling copy.
- Test New Image or Video Creatives: Introducing fresh visuals can reinvigorate your campaigns and capture your audience’s attention more effectively.
Targeting Refinements
- Add or Exclude Audience Signals: Fine-tune your audience targeting by adding high-performing segments or excluding those that aren’t delivering results.
- Adjust Geo-Targeting or Device Settings: Optimize your reach by focusing on locations and devices that yield the best performance metrics.
Budget Allocation
Reallocate your budget to asset groups that are driving the highest return on ad spend (ROAS). By directing more funds towards successful asset groups, you can maximize your overall campaign efficiency and profitability.
Challenges in Asset Group Analysis and How to Overcome Them
Analyzing asset group performance isn’t without its challenges. Here are some common obstacles and strategies to overcome them:
Common Challenges
- Data Overload: Managing multiple asset groups can lead to an overwhelming amount of data, making it difficult to identify key insights.
- Misinterpreting Metrics: Without proper context, metrics can be misleading, leading to incorrect conclusions and misguided optimizations.
Solutions
- Use Automated Scripts for Regular Reporting: Automate data extraction and reporting using Google Ads Scripts to streamline the analysis process and reduce manual workload.
- Cross-Check Performance Metrics Against Campaign Objectives: Always align your analysis with your broader marketing goals to ensure that your optimizations contribute to desired outcomes.
Tools and Resources to Simplify Analysis
Leveraging the right tools can significantly simplify the process of asset group analysis. Here are some essential resources:
Google Ads Scripts
Google Ads Scripts are invaluable for generating detailed, customized reports. They allow you to automate data extraction, ensuring you have up-to-date information without manual intervention.
Google Sheets
Use Google Sheets to organize and visualize your data. Its powerful functions and integration capabilities make it easy to analyze trends, create charts, and share insights with your team.
Third-Party Tools
Consider using advanced campaign analysis tools like Supermetrics, which can integrate with Google Ads and other platforms to provide comprehensive data visualization and reporting features.
Conclusion
Understanding and analyzing asset group performance in Performance Max campaigns is essential for maximizing your marketing results. By monitoring key metrics, extracting detailed data, and making strategic adjustments, you can ensure that your campaigns are not only efficient but also highly effective. Remember, the true power of Performance Max lies in your ability to combine automation with informed decision-making. Start analyzing your asset groups today to unlock the full potential of your campaigns and achieve better ROI.
Leave a Comment